Get contour lines
get_contours.RdGet contour lines, using a wrapper for contourLines
get_contours(df = NULL, levels = 0, ...)
Arguments
| df | A data.frame containing x, y, and z columns. x and y must form a raster, meaning every x must be represented for each y, and vice versa. |
|---|---|
| levels | A vector of values at which contours should be plotted. If used, nlevels is ignored. |
| ... | If x, y, and z are directly specified here, df will be ignored. |
Examples
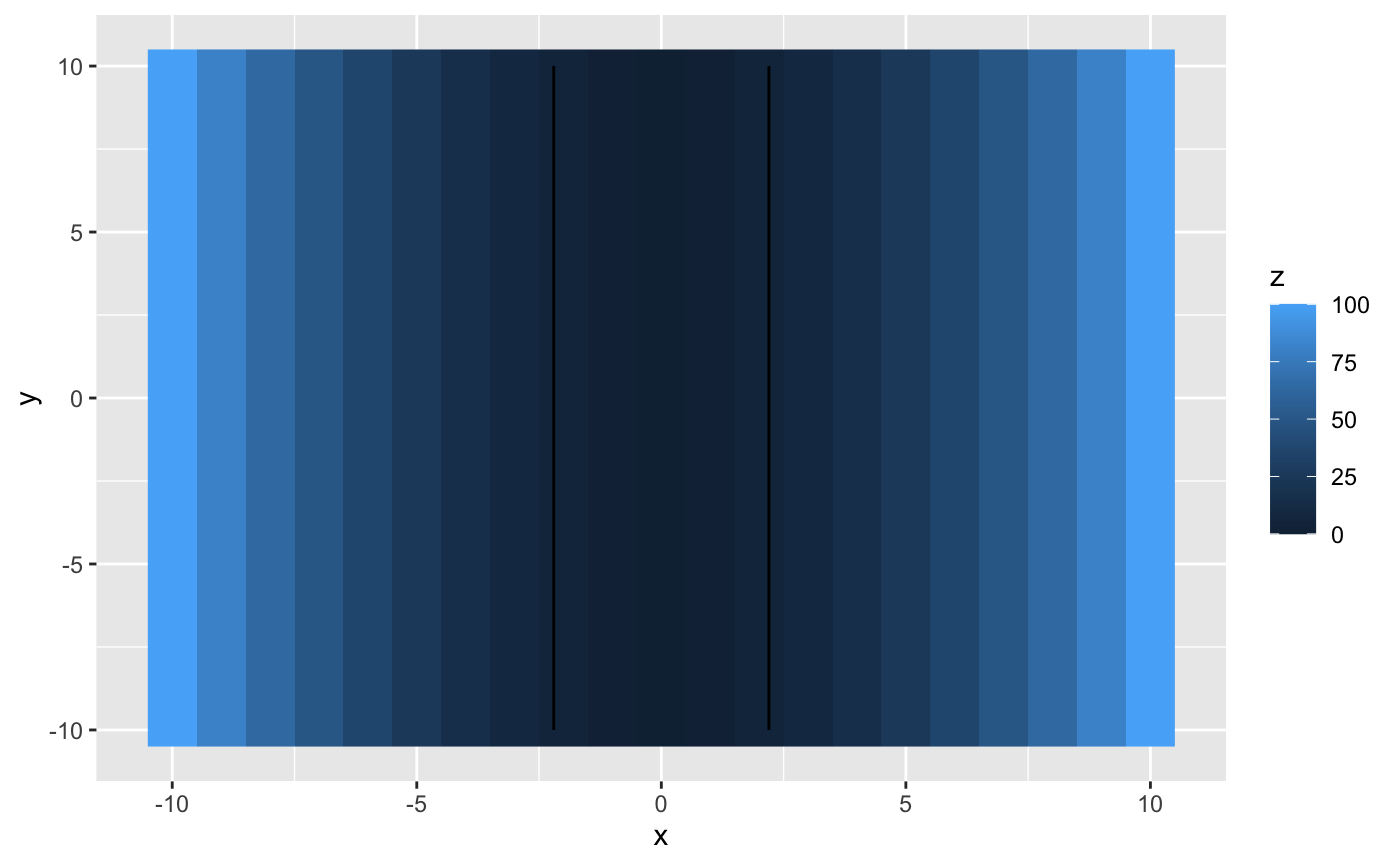
library(ggplot2) df <- expand.grid(x=-10:10,y=-10:10) df$z <- df$x^2 cl <- get_contours(df,levels=5) unique(cl$level)#> [1] 5#> [1] 15 20 60df <- expand.grid(x=seq(-5,5,length.out=20),y=seq(-5,5,length.out=20)) df$z <- sqrt(df$x^2+df$y^2) cl <- get_contours(df,levels=seq(2,10,by=2)) ggplot() + geom_raster(data=df,aes(x,y,fill=z)) + geom_path(data=cl,aes(x,y,group=line)) + coord_equal()