Map hydrodynamics
get_gridded_hydrodynamics.RdThis function is used for mapping hydrodynamics by generating gridded output of hydraulic head and flow direction
get_gridded_hydrodynamics(wells, aquifer, head_dim = c(20, 20),
  flow_dim = c(10, 10))
Arguments
| wells | Wells data.frame or tibble |
|---|---|
| aquifer | Aquifer object |
| head_dim | Vector containing number of rows and columns as |
| flow_dim | Vector containing number of rows and columns as |
Value
The function returns a list containing:
head: A data.frame of gridded hydraulic headflow: A data.frame of flow with griddedxandy, along withdxanddyfromget_flow_dir(), andx2andy2which are specifically intended for plotting usinggeom_segment()-- they are normalized so that the maximum value is equal to the grid spacing.
Examples
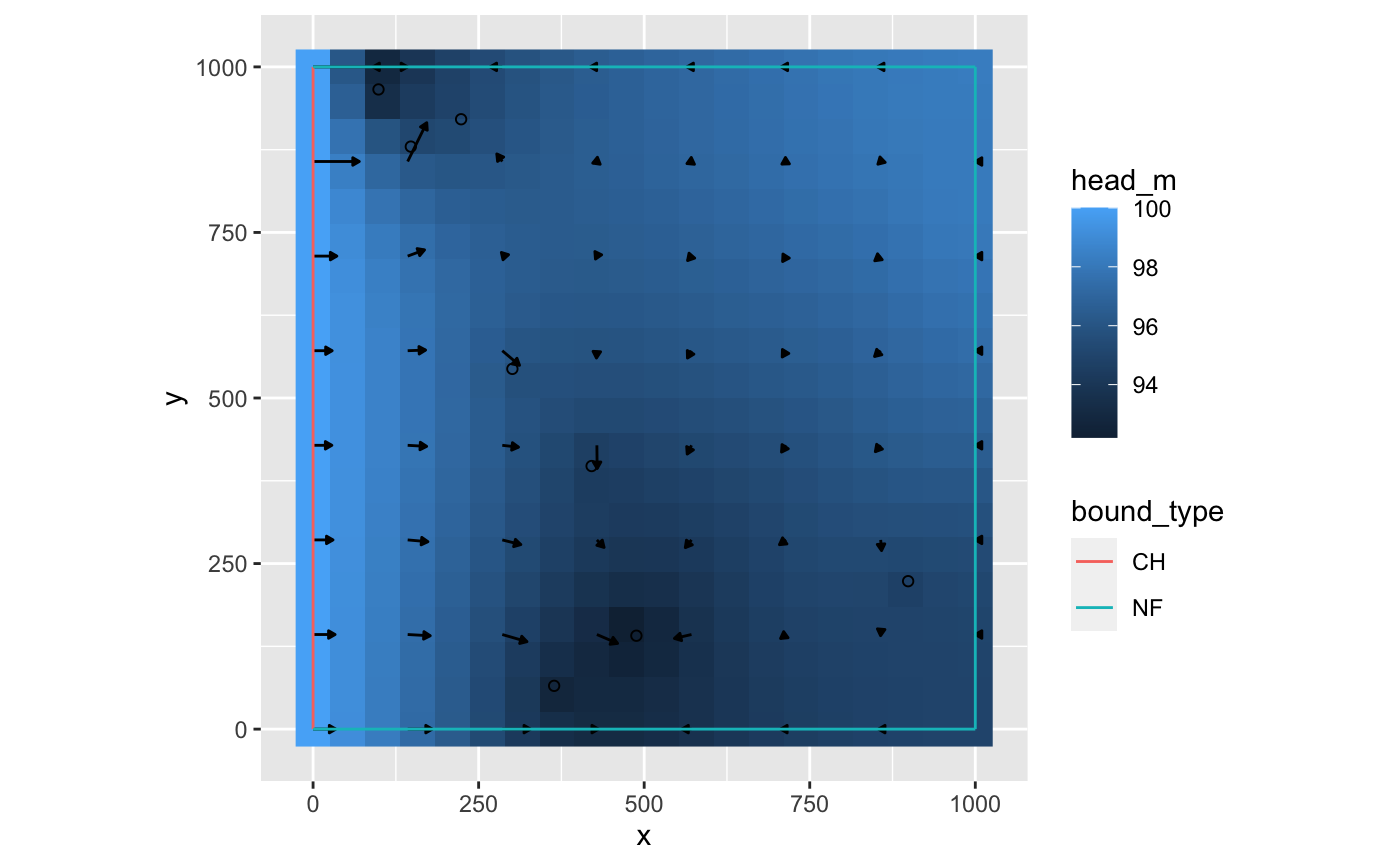
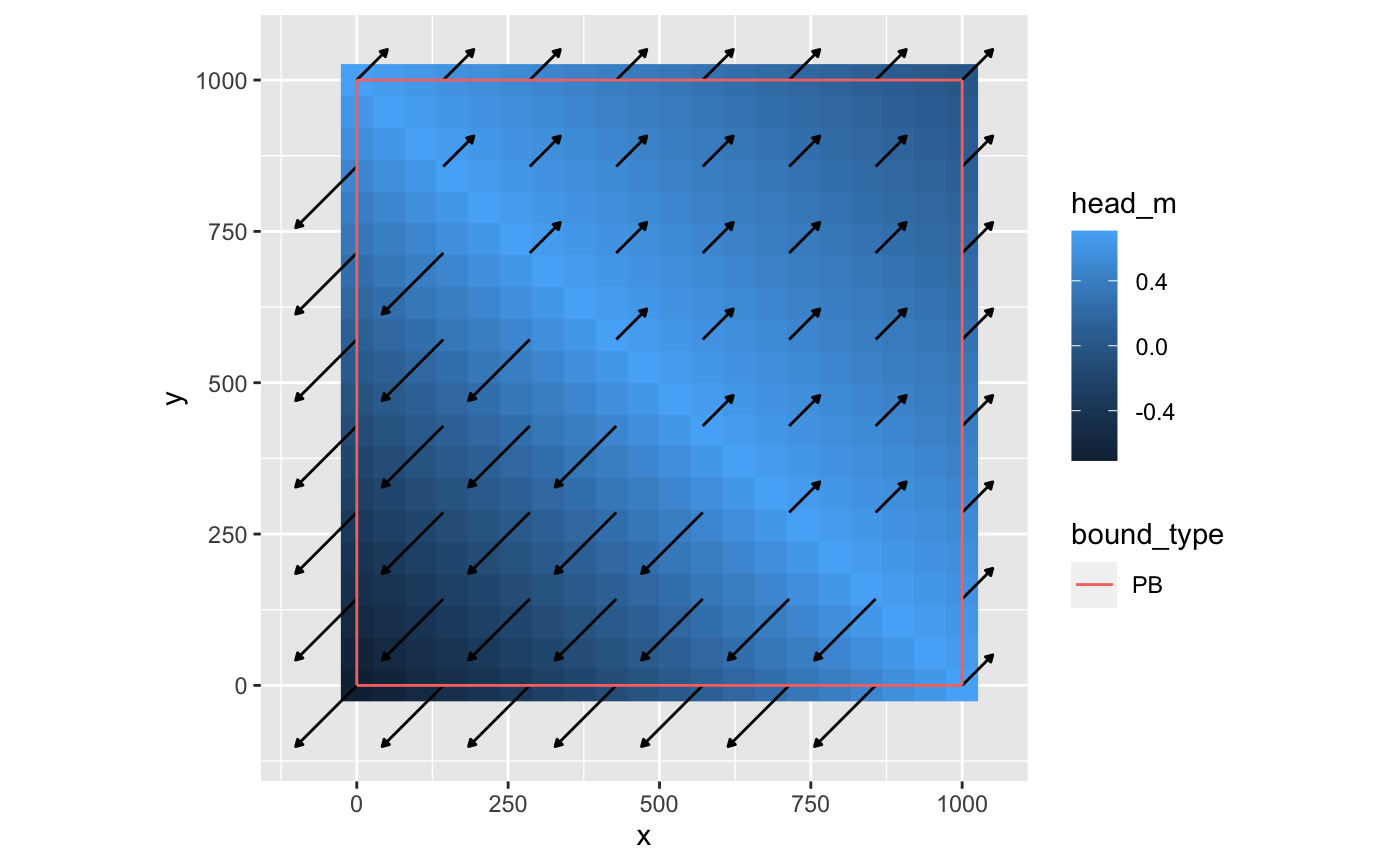
# define aquifer bounds_df <- data.frame(bound_type=c("CH","NF","NF","NF"),m=c(Inf,0,Inf,0),b=c(0,1000,1000,0)) aquifer_unconfined <- define_aquifer("unconfined",1e-3,bounds=bounds_df,h0=100) # define wells and well images set.seed(30) wells_df <- data.frame(x=runif(8,0,1000), y=runif(8,0,1000), diam=1, R=1000) wells_df$Q <- -1/(1:nrow(wells_df)) wells <- generate_image_wells(define_wells(wells_df),aquifer_unconfined) gridded <- get_gridded_hydrodynamics(wells,aquifer_unconfined,c(20,20),c(8,8)) library(ggplot2) ggplot() + geom_raster(data=gridded$head,aes(x,y,fill=head_m)) + geom_segment(data=gridded$flow,aes(x,y,xend=x2,yend=y2), arrow = arrow(ends="last",type="closed",length=unit(1,"mm")),color="black") + geom_segment(data=aquifer_unconfined$bounds,aes(x1,y1,xend=x2,yend=y2,color=bound_type)) + geom_point(data=wells[wells$wID==wells$orig_wID,],aes(x,y),shape=21) + coord_equal()#> Warning: Removed 2 rows containing missing values (geom_segment).recharge_params <- list(recharge_type="D",recharge_vector=c(500,500,501,501), flow_main=.001,flow_opp=.002,x0=1000,y0=1000) bounds <- define_bounds(data.frame(bound_type=rep("PB",4),m=c(Inf,0,Inf,0),b=c(0,0,1000,1000))) aquifer <- define_aquifer("confined",1,h0=0,z0=1,recharge=recharge_params,bounds=bounds) gridded <- get_gridded_hydrodynamics(wells=NULL,aquifer,c(20,20),c(8,8)) ggplot() + geom_raster(data=gridded$head,aes(x,y,fill=head_m)) + geom_segment(data=gridded$flow,aes(x,y,xend=x2,yend=y2), arrow = arrow(ends="last",type="closed",length=unit(1,"mm")),color="black") + geom_segment(data=aquifer$bounds,aes(x1,y1,xend=x2,yend=y2,color=bound_type)) + coord_equal()