Get hydraulic behavior along segments
get_segments_behavior.RdGet hydraulic head and flow on segments
get_segments_behavior(segments, wells, aquifer, length.out = 100)
Arguments
| segments | Either: (a) A data.frame containing sID, x1, x2, y1, y2, or (2) a vector containing c(x1,y1,x2,y2) |
|---|---|
| wells | wells object with each row containing rate Q [m^3/s], diam [m], radius of influence R [m], & coordinates x [m], y [m] |
| aquifer | Afuifer object containing aquifer_type, h0, Ksat, bounds, z0 (for confined case only) |
| length.out | The number of points to evaluate on each segment |
Value
Returns a data.frame, with length.out rows for each sID.
Each row represents a point along sID and contains the head and flow as:
dx = -Ksat * dh/dx, and
dy = -Ksat * dh/dy
Examples
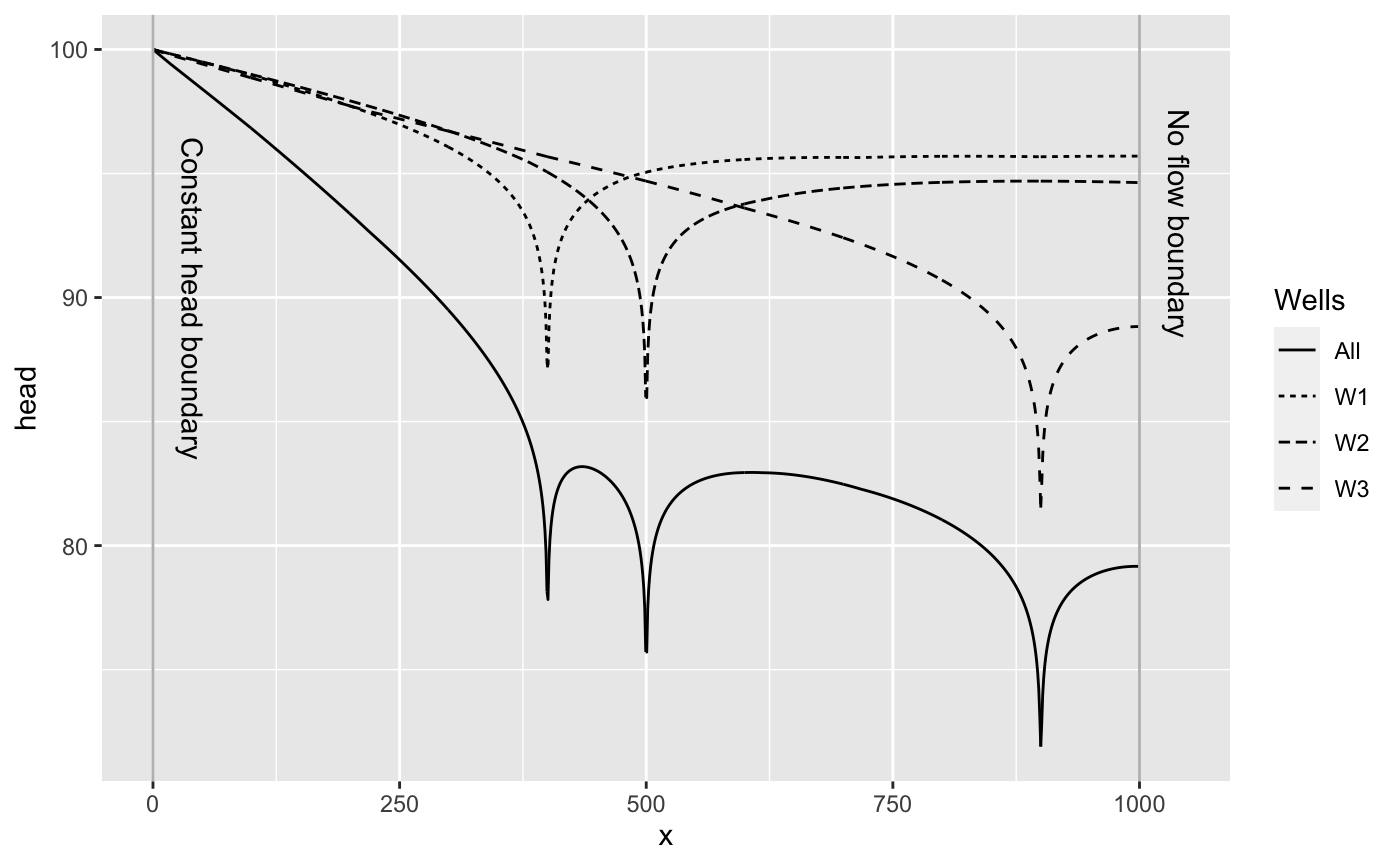
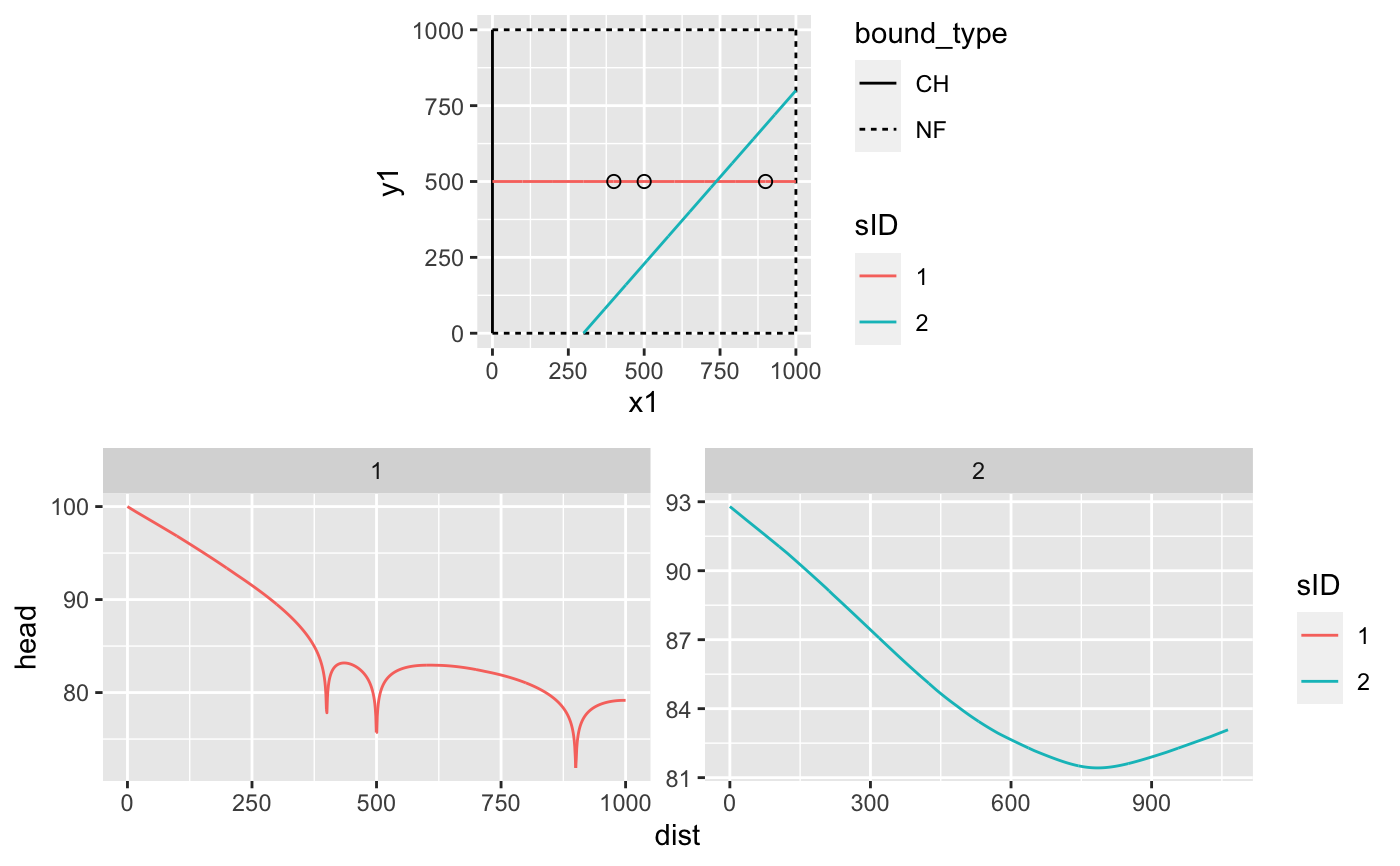
# define the aquifer aquifer <- aquifer_confined_example aquifer$Ksat <- 5e-4 # define wells and images wells_actual <- define_wells(data.frame(x=c(400,500,900),y=500,R=1500,Q=-0.1,diam=1)) wells <- generate_image_wells(wells_actual,aquifer) # set the segment seg <- c(0,500,1000,500) # get segment for each well and all wells seg_w1 <- get_segments_behavior(seg,wells[wells$orig_wID==1,],aquifer,1000) seg_w1 <- data.frame(seg_w1[,c("x","y","head")],Wells="W1") seg_w2 <- get_segments_behavior(seg,wells[wells$orig_wID==2,],aquifer,1000) seg_w2 <- data.frame(seg_w2[,c("x","y","head")],Wells="W2") seg_w3 <- get_segments_behavior(seg,wells[wells$orig_wID==3,],aquifer,1000) seg_w3 <- data.frame(seg_w3[,c("x","y","head")],Wells="W3") seg_all <- get_segments_behavior(seg,wells,aquifer,1000) seg_all <- data.frame(seg_all[,c("x","y","head")],Wells="All") # plot results library(ggplot2) seg_behavior <- rbind(seg_all,seg_w1,seg_w2,seg_w3) ggplot() + geom_line(data=seg_behavior,aes(x,head,linetype=Wells)) + geom_vline(data=data.frame(x=c(0,1000)),aes(xintercept=x),color="gray") + annotate(geom="text",x=40,y=90,label="Constant head boundary",angle=-90) + annotate(geom="text",x=1040,y=93,label="No flow boundary",angle=-90)# Example 2 segments <- data.frame(x1=c(0,300),y1=c(500,0),x2=c(1000,1000),y2=c(500,800),sID=1:2) seg_results <- get_segments_behavior(segments,wells,aquifer,1000) seg_results$sID <- as.factor(seg_results$sID) p_domain <- ggplot() + scale_fill_gradient2(low="blue",high="red",mid="gray")+ geom_segment(data=aquifer$bounds,aes(x1,y1,xend=x2,yend=y2,linetype=bound_type),color="black") + geom_path(data=seg_results,aes(x,y,color=sID)) + geom_point(data=wells[wells$well_image=="Actual",],aes(x,y),color="black",size=2,shape=21) + coord_equal() p_segments <- ggplot(seg_results) + geom_line(aes(dist,head,color=sID)) + facet_wrap("sID",scales="free") gridExtra::grid.arrange(p_domain,p_segments,nrow=2)